
How I Design Interface for Software
03 May 2017
For any software business, GUI is the universal endpoint to interact with their end-users and solve their real-life problems. And as a Designer, my job is to ensure that a right experience gets delivered during their interaction.
“Designing an Interface is like scripting a conversation between the business and their consumers to provide a pleasant experience in achieving their mutual goals.”
To provide a great experience, first I need to know about the business, their goals, perspectives, product timeline, end-users, technology stack etc. This information gives me more clarity and reasoning to the scope of the problems as well as the confidence to approach them. To find solutions, I usually follow a three stage process – Learn, Develop and Monitor (Fig-1).
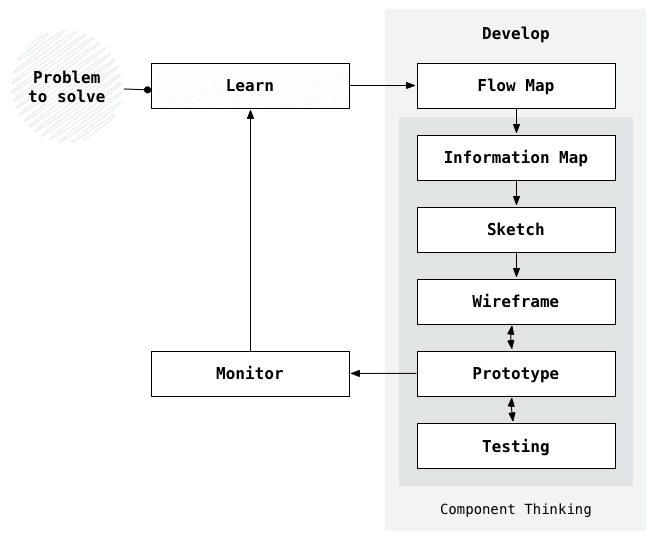
Learn
In this step, the primary focus is to understand and define the problem. And in order to get a better understanding, I collect many data sets from the target user. Collection of data sets usually involves different methods like observation, survey and interview. And once I have enough datasets, I extract out the scope which becomes the foundation of my solutions.
However, sometimes these datasets might not be accurate or the results might not be conclusive which may result in failure. Then again, these failures leave some insights behind to improve the product and the process itself.
“Failures are the best Teacher.”
Develop
Now that we have the scope and a better understanding of the problem, the next step is to explore solutions.
I prefer creating a user flow mapping in the first step itself for finding solutions. User flow mapping provides an overview of the information distributions and the corresponding actions. To simulate this user flow, I use a method called DoGo Mapping. DoGo helps me outline all user actions and the links to other screens, so I can optimise user hops even in the early stages.
Once the user flows are ready, I can start designing the interfaces of each screen. Basically, any interface is made of three fundamental elements:
- Data: the information on the interface,
- Action: the operations that a user can perform on the data
- Presentation: the arrangement of Data and Actions
“Among these three elements, Data is the most important element because - all the people uses or wants to use our products are only looking for information that they require to fulfil their goals.”
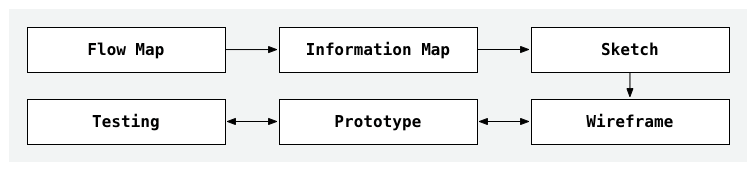
Keeping all these elements in mind, to design interfaces, I follow a methodology called Component Thinking. Based on this methodology, an interface is a composition of multiple building blocks called Components, emphasising the principle of Separation of Concerns. Means, components encapsulate a group of tightly coupled data and actions, but loosely coupled to each other. These encapsulations provide better control over the flow of information and enforce uniformity in visual design.
“Component ⊆ Interface.”
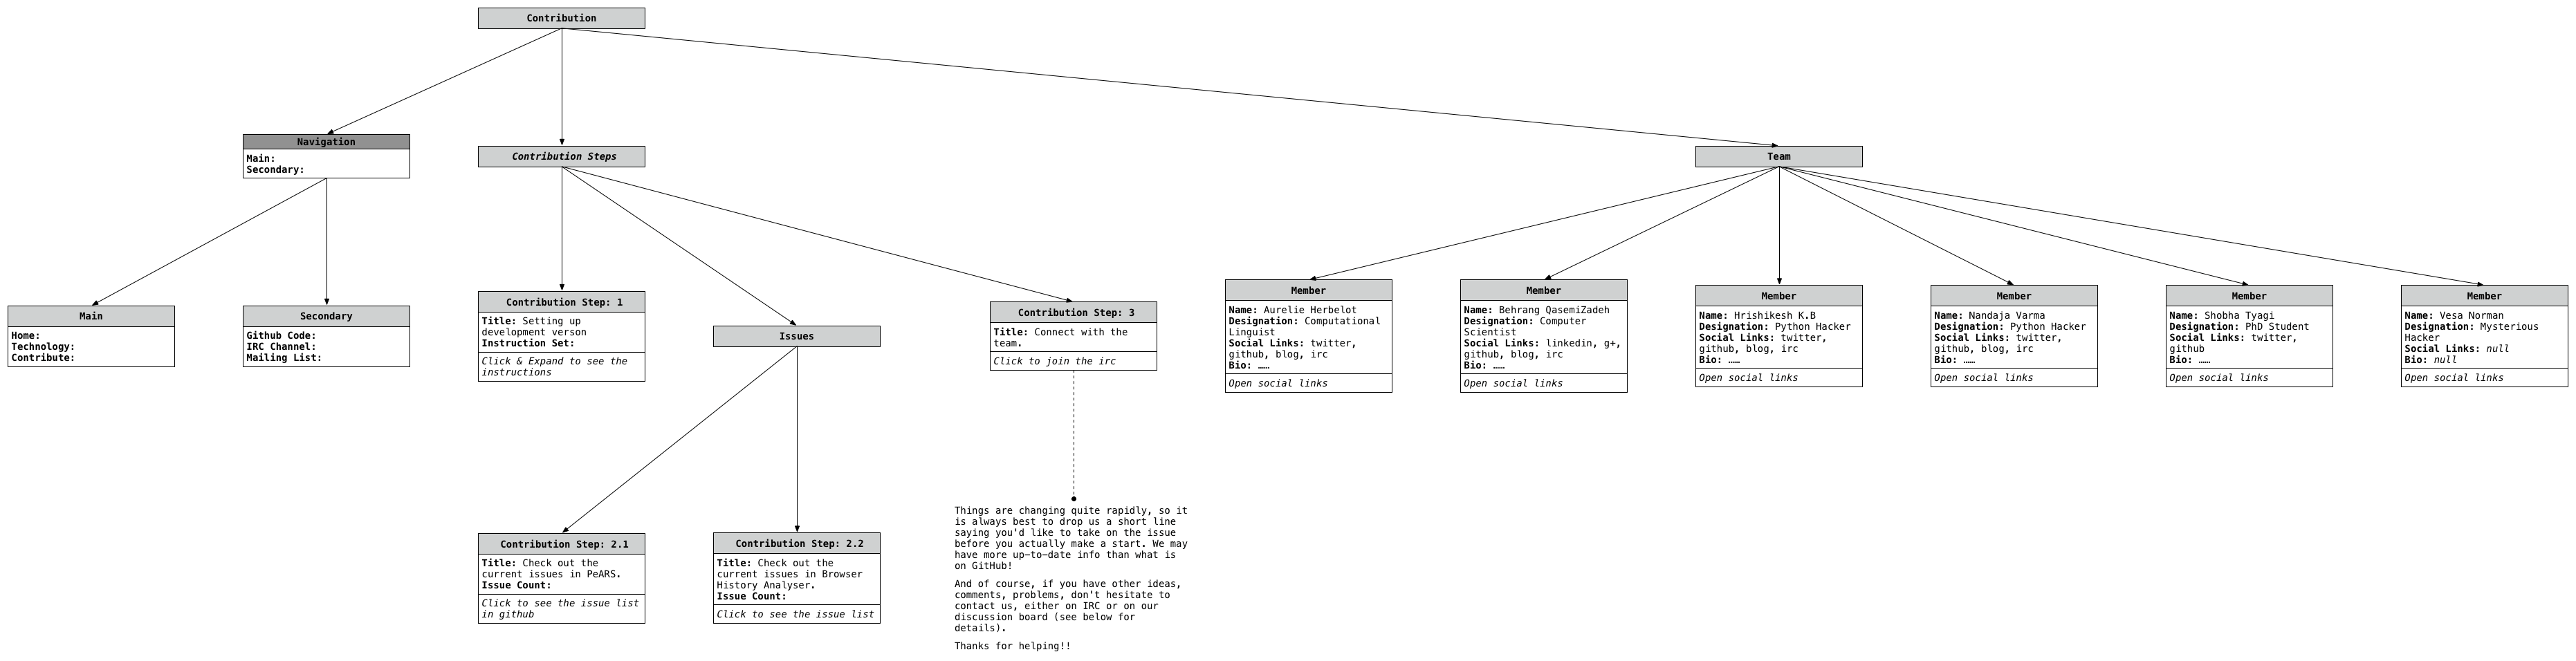
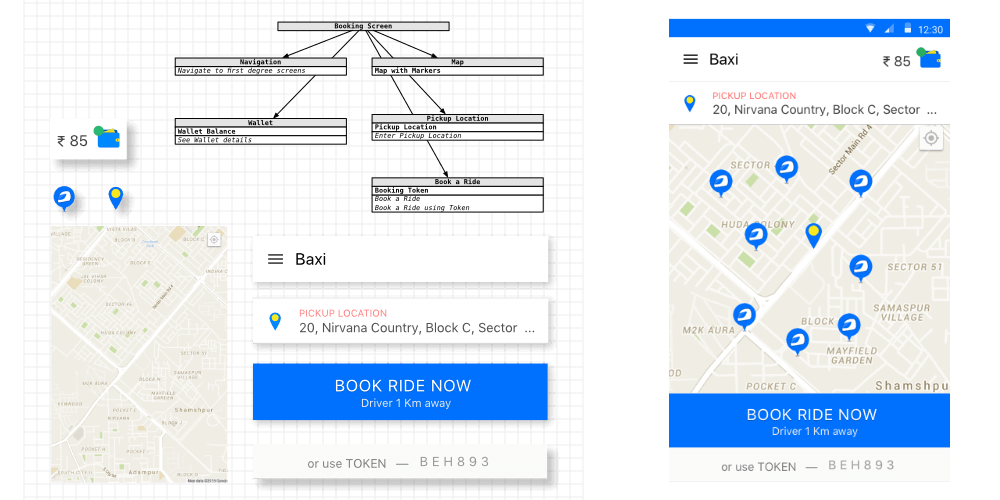
To identify the components, I prepare a map for the entire screen called Information Map (Fig-3) - a tree diagram where each node represents the group of correlated information and corresponding actions. i.e., components without presentation. This mapping not only helps in identifying the components but also identifying the data load on the page and provides a platform to structure the content and experiment new possibilities of arranging and organising information.
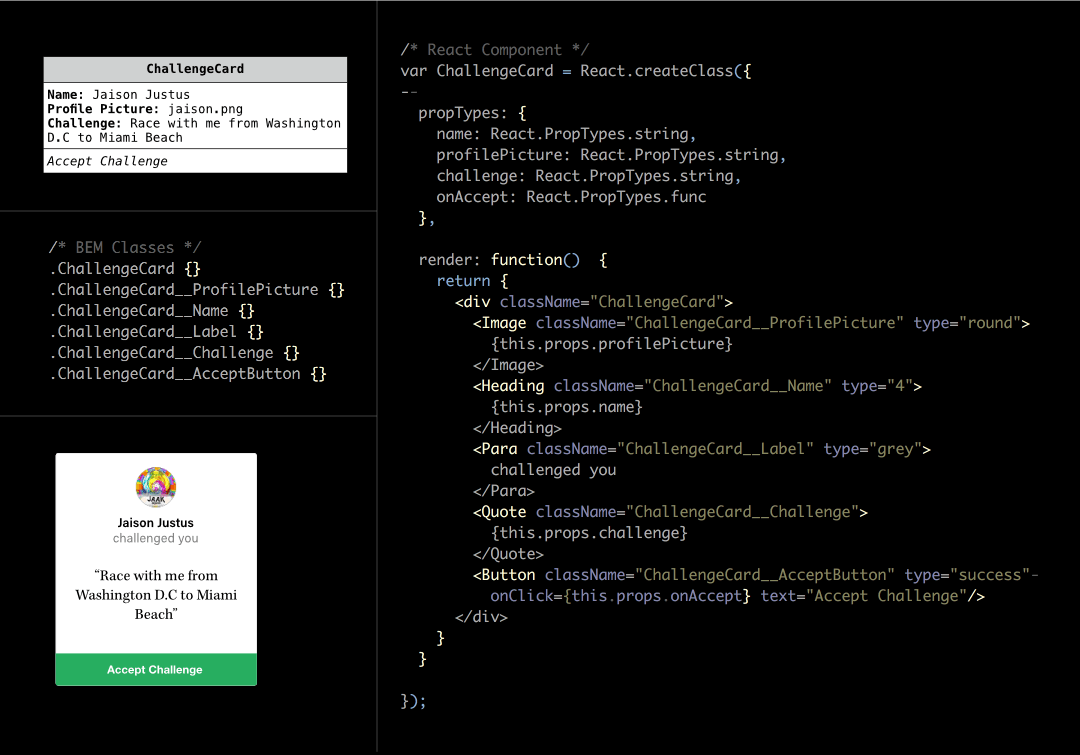
Another advantage of using Information Map is, for Front-End Engineers. Where they can use this map as a blueprint of the screen which provides a proper outline of the structure & order of data and of course components. For example in the picture below (Fig-4) demonstrate how an information map node is used to write a React component and BEM classes.
Once the raw components and its relations are ready, next step is to provide a presentation state for them. The process of transforming these raw data into a presentable state is an iterative effort, and to make it faster, Sketching is the right tool. It is one of the traditional skill in the software industry for iterating interface strategies to evolve from a concept stage to a more refined stage. And when the final sketches are ready, I create mockups, test the idea and finalise the visual design for implementation.
Monitor
“All the design decisions are bound to some business goals, so it should be evaluated.”
My evaluations are based on the traditional way of setting up analytics. which are as follows:
- prepare the list of user actions and attributes to track
- measure them using analytics tool
- generate reports and analyse the patterns and variations
- note down the improvements and issues
- do the changes, and measure again using the current report as baseline
Thank you for reading! For any questions feel free to mail me
